
EnviroPi
DeployedA swarm of Raspberry Pi sensor nodes, one central server, and a Discord ping before the lab overheats.
- Python
- Flask
- Pi Zero + Enviro+
- SQLite / PostgreSQL
- systemd
Why it exists
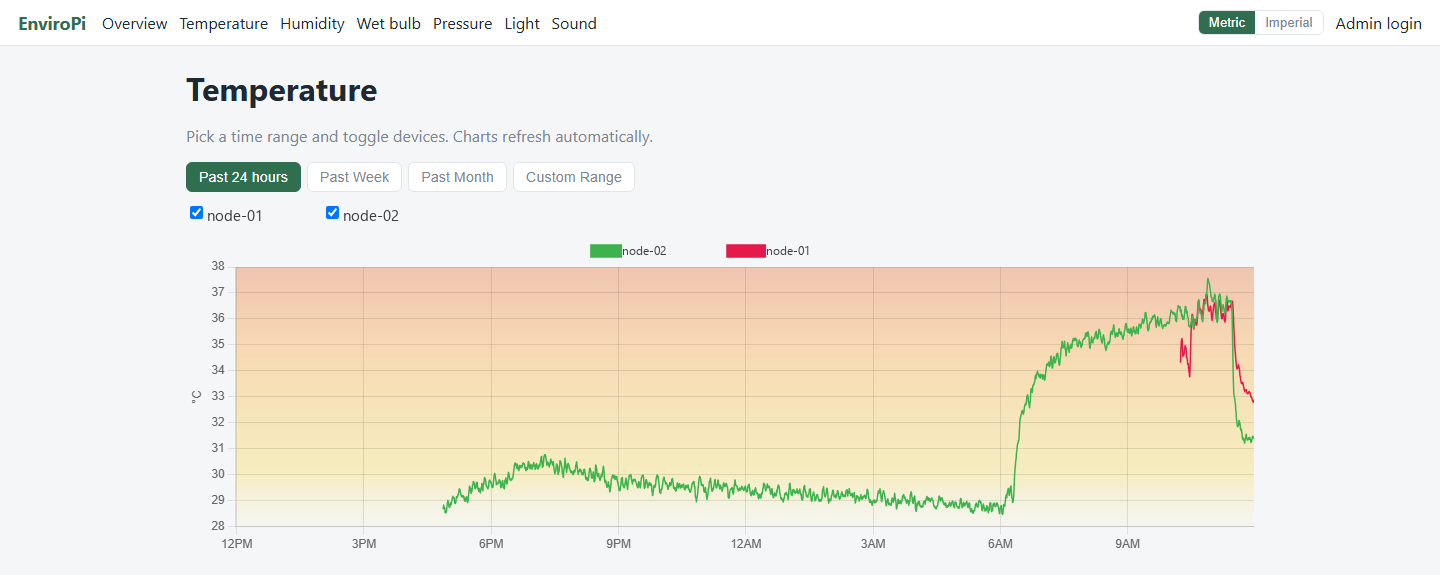
Rooms go bad quietly. The HVAC dies, a space heater gets left on, a server closet cooks over a weekend, and nothing tells you until you walk in and feel it. EnviroPi's whole job is making the room tell you first: a cheap sensor node in each room you care about, one dashboard for all of them, a Discord ping when a line gets crossed. Ours watches the lab for the day the air conditioner quits. The chart below is what a bad morning looks like: flat overnight, then climbing hard after 6 AM.
What it is
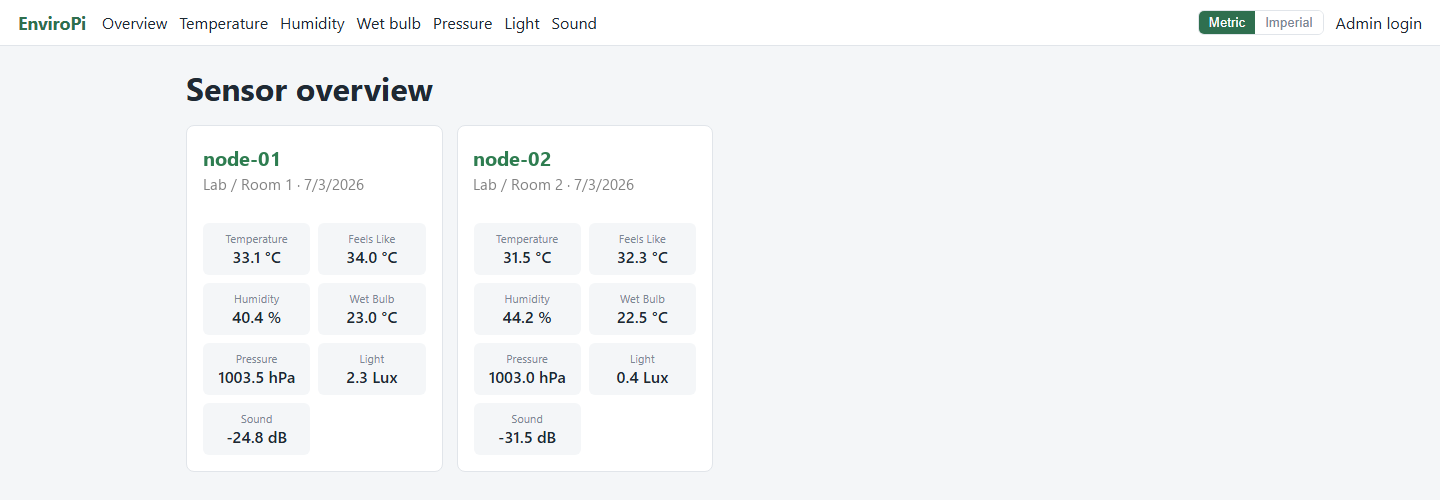
Each node is a Pi Zero wearing a Pimoroni Enviro+ hat. It samples temperature, humidity, pressure, light, and sound every 15 seconds and pushes to a central Flask server, which stores everything, draws the charts, and checks the alert rules as each batch lands. Anyone on the network can see the dashboards without an account. Each node also has a little LCD that flips between a network view and a climate view with trend arrows, which sounds like a gimmick until you're standing next to one wondering if it's online. Two nodes are on duty right now. Parts for the third are on the bench.
How it works
 [Enviro+ node]──┐
 [Enviro+ node]──┼── HTTP POST /api/ingest ──▶ [central server] ──▶ [database]
 [Enviro+ node]──┘    (per-device API key)         │      │
      │                                            │      └──▶ Discord webhook
      └── 0.96" LCD: network + climate views       └──▶ dashboards + admin UI
The agent on the node is one Python process under systemd. Every 15 seconds it reads the BME280, the LTR559, and the onboard mic, stamps an NTP-disciplined UTC timestamp, and appends the reading to a durable queue on disk. Batches leave that queue only when the server acknowledges them. The LCD gets its own thread so a slow screen never blocks a reading. The whole agent stays Python 3.7-compatible, because that's what a Pi Zero from the parts bin ships with.
The server is a Flask app split into blueprints: public read-only dashboards and a JSON API, a key-authenticated ingest endpoint, an admin UI for devices, keys, alerts, and users, and the alert engine behind the Discord webhook. Every reading carries two timestamps, the node's clock and the server's receive time, so clock drift and backfills show up instead of hiding. SQLite in development, PostgreSQL in production, same code either way. Alembic handles the schema.
Numbers no sensor sends
The BME280 sits close enough to the Pi's CPU that it reads a few degrees
warm. So the agent reads the CPU temperature too and corrects for it:
comp = raw - (cpu - raw) / factor. That factor is per-board;
our two nodes need 1.8 and 2.69 with the identical hat, which is why
there's a calibration tool instead of a constant. Run it on a known-good
node, run it with --match on the new board sitting next to
it, and it prints the number to install.
A warm-skewed temperature also skews humidity dry, since relative humidity is relative to temperature. The agent rescales raw humidity by the ratio of saturation vapor pressures at the raw and corrected temperatures, so the moisture stays the same and the temperature becomes the right one.
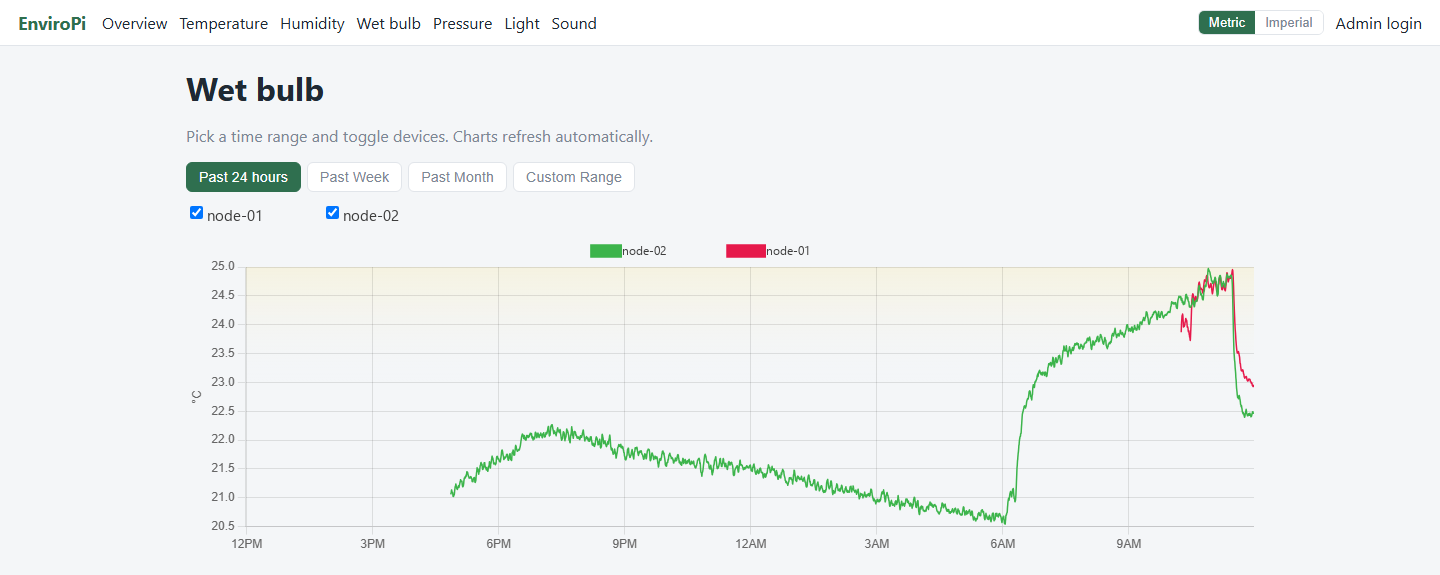
From those two, the server derives wet-bulb temperature at ingest (Stull's 2011 approximation) and stores it as a first-class variable. It charts, it alerts, and it backfills like anything a sensor sent, even though no sensor sent it. Wet bulb is the number that matters for heat safety; it tells you how much evaporative cooling has left.
"Feels like" is the NWS heat index, computed in the browser from each node's latest reading. It's a comfort estimate rather than a measurement, so it's shown but never stored.
The parts that took actual thought
Nothing gets lost. A node deletes a reading from its queue only after the server acknowledges it, and inserts are idempotent, so retries can't duplicate anything. We got to validate that the honest way when the server went down for 18 hours. The nodes just kept queueing, backfilled about 21,500 readings when it came back, and the charts have no gap.
Alerts fire once, on the rising edge of a breach, stay latched while it holds, and re-arm only after the value crosses back past a deadband. Nobody needs 400 pings about the same hot room. Delivery is isolated from ingest too, so a dead webhook never delays a reading, and the alert event is recorded either way.
Nodes authenticate with per-device API keys: 256-bit tokens, stored only as SHA-256 hashes, shown in plaintext exactly once. A device can hold more than one key, so rotation needs no downtime. Reading is open to the LAN; writing anything requires the admin login.
Some rooms need to be RF-silent, so the deploy scripts can disable a board's WiFi and Bluetooth at the firmware level, where it survives reboots and updates. One node skips the question entirely: no wireless hardware, USB ethernet uplink.
Run it yourself
EnviroPi is MIT-licensed and the code is public: git.eurekaendeavors.com/enviropi/enviropi. The README gets you from clone to dashboard in five commands.